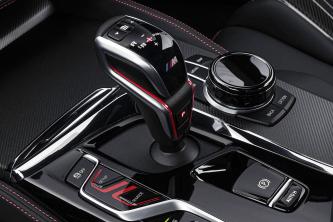
torque graph
torque graph Related Articles


2021 Nissan X-Trail engine details revealed
likely to soldier on with its predecessors 2.5-litre QR25DE powerplant, albeit with improved horsepower, torque
The Volvo S60 T8 does 0-100 km/h in 4.4s, what cars can it keep up with?
far the largest capacity engine here, the 5.0-litre naturally aspirated V8 makes 477 PS and 540 Nm of torque
Is it true that eco tires have poorer grip and braking?
resistanceTypically, tires are either low hysteresis and low grip at all frequencies (Refer green line graph
Leaked: Subaru's product plan! New-gen Subaru WRX to come in 2021?
this with a pinch of salt as Autoguide did not offer any context with only an explanation that the graph
Why the W205 Mercedes-Benz C200 1.5-litre EQ Boost died so soon in Malaysia?
Torque is also given a 20 Nm bump to 300 Nm.
The Pros and Cons of CVTs - Why we love them and why we hate them?
Because a CVT maintains the engine rev at its optimum range, there is no need to rev and build up torque
2020 Volkswagen Tiguan Allspace 1.4 TSI vs 2.0 TSI - Do you need the extra power?
TSI Highline is powered by a 1.4-litre turbocharged 4-cylinder engine that makes 150 PS and 250 Nm of torque
Proton X70 CKD: Will the dual-clutch transmission be reliable?
will be fitted with a new 7-speed wet-type dual-clutch automatic transmission, superseding the 6-speed torque
Here are some cars that go fast in style and comfort like the 620 PS McLaren GT
options), the McLaren GT is motivated by a 4.0-litre twin turbocharged V8 that makes 620 PS and 630 Nm of torque
Deliveries of the 2021 Honda City RS to start this March
Boasting 253 Nm of torque thanks to its i-MMD hybrid powertrain, the City RS does give near-instantaneous
2020 Proton X70 CKD: What's new compared to before?
It still makes 184 PS as before but torque has been increased by 15 Nm, now twisting 300 Nm of torque.Engine
Should you buy the Proton X50 or wait for the Perodua D55L?
The D55L uses a 1.0-litre turbocharged 3-cylinder engine with 98 PS and 140 Nm of torque paired to a
Next-gen Toyota 86/Subaru BRZ to get N/A 2.4L engine with 220 PS/240 Nm
torque.Compared to the current generation’s 2.0-litre engine, that one makes 207 PS and 212 Nm of torque
Perodua Ativa's (D55L) CVT to be better than Proton's. What's the D in D-CVT?
higher speeds, the clutch engages and power is routed to the planetary gear set, creating a simulated torque
Updated Mazda MX-5 RF Now In Malaysia, Priced From RM 259,154
slight increase in power, as Mazda engineers have managed to squeeze out an additional 24 PS and 5 Nm of torque
The 7-speed wet DCT makes the 2020 Proton X70 CKD faster and more fuel efficient
popular SUV is the change to a 7-speed dual-clutch transmission (DCT), replacing the conventional 6-speed torque
New Peugeot 3008 facelift debuts with 520 Nm, double the torque of Honda City RS
2021 (W213) Mercedes-Benz E-Class facelift launching in February in Thailand, Malaysia next?
Mercedes-Benz E220d is powered by a 2.0-litre 4-cylinder turbodiesel engine that makes 194 PS and 400 Nm of torque
3-cylinder engine vibration, noise, and reliability: Still a problem?
Look at the graph above and you will see that the three-cylinder still vibrates more.What manufacturers
2021 Ford Bronco looks set to wrangle the competition
mm.Powering the Bronco will be a choice of a 2.7-litre EcoBoost V6 engine which produces 314 PS and 542 Nm of torque
torque graph Post Review
If you only look at one #488GTB graph... The variable torque mapping 1-3, 4, 5, 6 and 7th. http://t.co/YGgBZh3jSl
The first scatter plot shows all absolute MOTUS torque and Rapsodo Velocity scatter points, while the bar graph here shows within subject differences. The whole population of data points comes from Driveline TRAQ throwers with at least 50 associated (Motus x Rapsodo) throws. https://t.co/vv0VJ2LlW2
Callaway Big Bertha 11* Driver MRH Proforce 65 Gold Low Torque Reg Graph (T6593) https://t.co/16a6wMSwlK
There’s an all-new rear subframe and the geometry has been revised too. The rake is sharp at 24.5deg. Tractability is the name of the game, as per the power and torque curve graph. #ScramblerDucati1100 https://t.co/DVShOedkkO
We've been playing around with a lot of paired datasets. A quick look at recent Motus and Rapsodo data shows an interesting trend of cutters and two-seam fastballs having higher average relative torques to fastballs from our population. #PreparetoDominate
@WesleyMorganSHS If you’re doing a version of this lab where they graph torque vs alpha, there will be a positive intercept on the torque axis which represents frictional torque. Great opportunity to ask “how come?”
#sbike Aprilia RSV4 dyno torque graph: For engine output dweebs: the torque dyno curve for the new Aprilia RSV4, against http://url4.eu/1gk
Anyone have the power and torque graph for the 3.2 SI6 motor ? #Volvo http://t.co/fs0syJc0
graph after torque of vehicle on a track: graph after torque of vehicle on a track #MATLABCentral
Here is the torque graph for the current setup. Notice it starts up way higher on the graph and peaks sooner.... http://fb.me/LyefZgGi
torque graph Q&A Review
Where can I find the torque graph for the turboprop engine?
To the best of my knowledge, turboprop/turboshaft engines are not rated for torque, they're rated by horsepower. The underlying principle is that of a gas turbine and they're usually expected to operate at more-or-less constant RPM most of their running time, hence perhaps the dearth of torque claims. Here's one, for ship propulsion.
What does the torque produced at the wheels vs motor RPM graph look like for a Tesla Model S?
What does the torque produced at the wheels vs motor RPM graph look like for a Tesla Model S? Easy peasy Electric motors have a very simple Torque curve - It starts flat and then drops off The actual numbers will depend on the motor and controller and battery - but the shape will be similar Note this is the “Available” torque - for a powerful car like the Tesla the controller will be limiting it to maintain tyre grip
Does the torque vs. horsepower graph vary if I modify the car by adding or removing weight? The engine and transmission system are untouched.
Nope, the torque (and therefore power) produced by an engine is completely independent of the weight of the car. BUT… By removing weight the acceleration of the car will greatly improve. According to Newtons Law: F = m.a So by keeping F constant (the force of the wheels on the road) and by lowering mass (m) acceleration (a) will increase. This is of course dependent on a lot of factors such as grip and what not, but in general it holds true. Hope this helped.
If power and torque are the same, then why are they on different graphs over rpm?
Torque and power are different physical concepts. But in the context of an engine or motor driving a driveshaft, like in a car, they mean pretty much the same thing. More precisely, they are different ways to measure the same property[1] of the engine or motor. Similar to how you might measure the walking distance to school in yards, or minutes at a constant walking pace. An engine does not “have,” say, 150 ft-lb of torque or 143 horsepower. It has 150 ft-lb of torque, or 143 hp, at 5000 rpm. The point is that you need to know the current rpms of the engine to know either torque or power, and that lets you convert from one to the other. Torque is the twisting force applied to the driveshaft or axle. If it were attached to just a (frictionless) flywheel, the same torque that accelerates the flywheel from, say, 0 to 100 rpm in 1 second, would increase its rotation by 100 rpm in 1 second regardless of its starting speed. Power is the amount of work done ,in a given time., ,But it is easier to understand as the amount of effort the engine or motor needs to exert to produce a given torque at a given speed. It is proportional to speed; that is, it requires twice as much effort to create a specific amount of torque at 2000 rpm, as it does at 1000 rpm. When the units are foot-pounds and horsepower, they are related by the equation HP = FT.LB*RPM/5252 Because this scaling puts the results for typical cars in the same numeric range, they are often plotted as two curves on the same graph, by interpreting the Y-axis appropriately for each. But they can be plotted as one curve on a plot that, without the curve, looks like this: This plot essentially has three axes. The (horizontal) X-Axis is RPMs, the (vertical) Y-Axis is torque, and the ,Parametric Axis ,is power, represented by reciprocal curves in the figure as labeled on the right side. Here is an example: So at 3000 rpm, this engine can produce about 130 ft-lb of torque, or about 75 horsepower. The markers represent the peaks of torque and horsepower. [1] The property is the one that is most important to the driver of the car: its acceleration. How an engine produces acceleration depends on several other factors, including the mass M of the car, the velocity V of the car, the gear ratio G between the drive shaft and the wheels, the engine’s rate of rotation ω, and the radius R of the wheels. M, R, and G are properties of the car (G is a changeable property, but it is a property of the car). V and ω are properties of the current driving state. What may not be obvious, is that V and ω are related through the gear ratio G. Specifically, V=k*ω/G, where k depends on the car’s parameters. So, based on the car’s parameters including the current G, the rates V and ω measure the car’s speed in different units. Similarly, the power P and the torque T measure the engine’s ability to accelerate the car in different units. This is because P’s effect on acceleration has to be interpreted through the velocity V, and T’s effect has to be interpreted though the gear ratio G=k*ω/V. The point is that P and T measure the acceleration of the car based on different subsets of the car’s state. Since the respective subsets can be derived from each other, P and T measure the same thing. In different units. ,But you have to look beyond the fact that they use different units, into how they determine acceleration based on the car’s situation, to understand this.
 HOME
HOME